domain:nature.com
PCA did not produce correct and\or consistent results across all the design schemes, whether even-sampling was used or not, and whether for unmixed or admixed populations. We have shown that the distances between the samples are biased and can be easily manipulated to create the illusion of closely or distantly related populations. Whereas the clustering of populations between other populations in the scatter plot has been regarded as “decisive proof” or “very strong evidence” of their admixture, we demonstrated that such patterns are artifacts of the sampling scheme and meaningless for any bio historical purposes. Sample clustering, a subject that received much attention in the literature, e.g., Ref., is another artifact of the sampling scheme and likewise biologically meaningless (e.g., Figs. 12, 13, 14, 15), which is unsurprising if the distances are distorted. PCA violations of the true distances and clusters between samples limit its usability as a dimensional reduction tool for genetic analyses. Excepting PC1, where the distribution patterns may (e.g., Fig. 5a) or may not (e.g., Fig. 9) bear some geographical resemblance, most of the other PCs are mirages (e.g., Fig. 16). The axes of variation may also change unexpectedly when a few samples are added, altering the interpretation.
Specifically, in analyzing real populations, we showed that PCA could be used to generate contradictory results and lead to absurd conclusions (reductio ad absurdum), that “correct” conclusions cannot be derived without a priori knowledge and that cherry-picking or circular reasoning are always needed to interpret PCA results. This means that the difference between the a posteriori knowledge obtained from PCA and a priori knowledge rests solely on belief. The conflicting PCA outcomes shown here via over 200 figures demonstrate the high experimenter’s control over PCA’s outcome. By manipulating the choice of populations, sample sizes, and markers, experimenters can create multiple conflicting scenarios with real or imaginary historical interpretations, cherry-pick the one they like, and adopt circular reasoning to argue that PCA results support their explanation.
...
Indeed, after “exploring” 200 figures generated in this study, we obtained no a posteriori wisdom about the population structure of colors or human populations. We showed that the inferences that followed the standard interpretation in the literature were wrong. PCA is highly subjected to minor alterations in the allele frequencies (Fig. 12), study design (e.g., Fig. 9), or choice of markers (Fig. 22) (see also Refs.57,68). PCA results also cannot be reproduced (e.g., Fig. 13) unless an identical dataset is used, which defeats the usefulness of this tool. In that, our findings thereby join similar reports on PCA’s unexpected and arbitrary behavior. Note that variations in the implementations of PCA (e.g., PCA, singular value decomposition [SVD], and recursive PCA), as well as various flags, as implemented in EIGENSOFT, yield major differences in the results—none more biologically correct than the other. That the same mathematical procedure produces biologically conflicting and false results proves that bio historical inferences drawn only from PCA are fictitious.
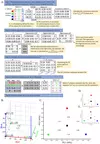
I highly recommend reading the entire article. It is quite detailed. They do PCA analyses with a toy model using colors with admixture and show that choice of inputs can yield an admixed population (the color Black) arbitrarily close to any of its component mixtures (Blue, Green, or Red) on a scatter plot of their principle components. They also go through data sets of some other population genetics studies and show how using those data sets can generate conflicting PCA results depending heavily on the researchers choice of inputs.

